

Editor’s Note: This article was updated in April 2023 with new findings from WRI’s dataset tracking electric school bus adoption in the United States, covering October to December 2022. To the best of our knowledge, these statistics are updated as of Dec. 31, 2022. Our next update is expected in September. Previous versions of this article are available for download at the bottom of this page.
Electric school bus adoption continues to expand in the United States. As of December 2022, there are 1,398 electric school buses that are either on order, delivered or operating. In total, there are now 5,612 committed electric school buses, almost double the number of buses since the release of WRI’s September 2022 dataset. The majority of this growth is due to the U.S. Environmental Protection Agency’s (EPA) Clean School Bus Rebate Program, which awarded over $900 million for more than 2,400 electric school buses to 389 school districts.
Thanks to this program, there are now electric school bus commitments in all 50 states, Washington, D.C., American Samoa, Guam, Puerto Rico the U.S. Virgin Islands and four tribal nations including the Morongo Band of Mission Indians, Mississippi Band of Choctaw Indians, Lower Brule Sioux Tribe and the Soboba Band of Luiseño Indians. This unprecedented level of funding comes from the Bipartisan Infrastructure Law of 2021 and would not have been possible without the tireless advocacy work of groups across the country.
Why Are Electric School Buses Important?
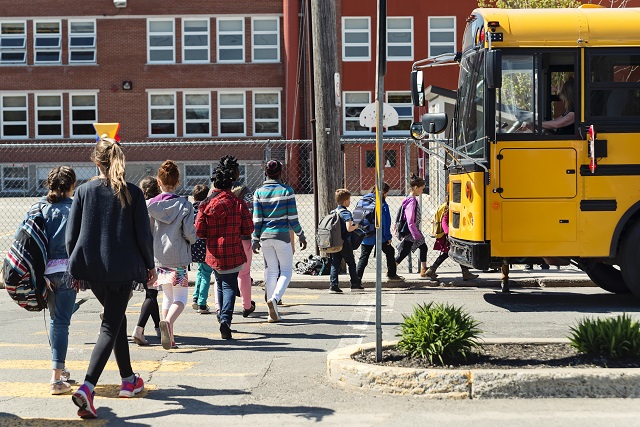
More than 20 million children ride the bus to school and over 90% of these school buses run on diesel. Diesel exhaust, a known carcinogen, has proven links to serious physical health issues as well as cognitive development impacts. Daily exposure contributes to asthma and other respiratory diseases. Evidence increasingly suggests that children are especially susceptible to these impacts. This year, the Electric School Bus Initiative published the first nationwide dataset of asthma rates by school district, based on census tract-level data from CDC PLACES and found that encouragingly, the number of electric school buses in areas with high rates of adult asthma is rising, meaning more communities will have access to cleaner air.

Students from low-income families are particularly exposed to the dangers of diesel exhaust pollution: 60% ride the bus to school, compared to 45% of students from families with higher incomes. Children of color are more likely to suffer from asthma, due in part to historically racist lending, transit, housing and zoning policies that concentrated Black and Brown communities closer to highways and other sources of vehicle-based air pollution. In addition, children with disabilities often ride longer on buses. Electrifying the entire fleet of school buses can help address these health concerns and inequalities.
Electric school buses don’t have any tailpipe emissions, reducing students’ exposure to harmful pollutants, which studies have shown can have positive and significant effects on student test scores — in some cases, on par with increased teacher experience levels.
Electric school buses also have significantly lower greenhouse gas emissions than diesel or propane-powered school buses, even after accounting for emissions for electricity generation. Plus, unlike other fuels, the use of electric buses will continue to reduce greenhouse gas emissions from the transportation sector as more electricity generation comes from renewable energy. School bus electrification can also offer resiliency support to the electric grid by providing access to large batteries when not in use and add jobs in the growing electric vehicle industry, although this transition needs to be thoughtfully managed with equity considerations in mind.
WRI has been tracking electric school bus adoption across the U.S. and recently released updated data covering the fourth quarter of 2022.
Here are the key findings and trends from this new data:
The United States Has More Than 5,500 Committed Electric School Buses
We consider an electric school bus “committed” when a school district or fleet operator has been awarded funding to purchase it or has made a formal agreement for a purchase with a manufacturer. Committed buses also include those in operation and buses that have been delivered to the school district or fleet operator.
Our previous data of committed electric school buses included a contract between SEA Electric and Midwest Transit Equipment to repower 10,000 school buses to electric over five years. We have since determined that this unique arrangement does not fit into our definition of “committed” as it does not include a school district or fleet operator to date. Thus, the buses under this agreement have been removed from our total count when analyzing adoption trends. As buses produced under that order are linked to a fleet operator or school district, we will add them into our analysis. For more information, please read the technical note.
Despite this reclassification, the number of “committed” electric school buses continues to grow rapidly: As of December 2022, we identified 5,612 electric school buses that have been awarded, ordered, delivered or are operating across the U.S. There are 413 new school districts or private fleet operators that have committed to adding electric school buses to their fleets since September 2022, bringing the total number to 895. This is almost double the number of both buses and districts with electric school buses in just three months. There are almost triple the number of districts since our first count in the summer of 2021, while the amount of electric school buses committed has increased nearly five-fold.
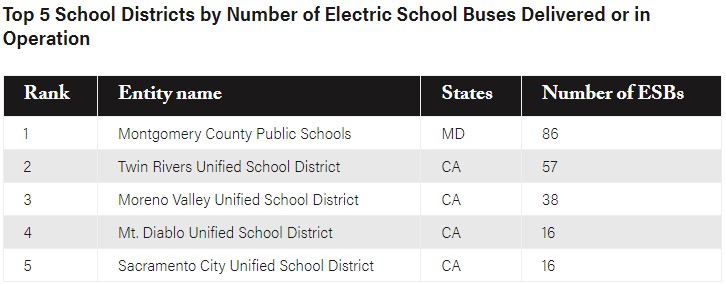
We collect data on four phases of the electric school bus adoption process that fit under the umbrella term “committed:” “awarded,” “ordered,” “delivered” and “in operation.” As of December 2022, 971 electric school buses in 37 states have been delivered or are in operation — about the size of the entire school bus fleet of Milwaukee Public Schools in Wisconsin.
Our research shows that an average of 17 months passes between the awarding of funds to the delivery of the electric school bus. This range varies from less than three months to almost four years, but the amount of overall time is less since the first electric school bus hit the roads in 2014. Supply chain issues during the COVID-19 pandemic have exacerbated delivery delays for all school bus types. While these have improved since 2020, such delays are expected to continue for some time.
Electric School Buses are Committed in all 50 States; One-Third are in the South
All 50 states now have electric school bus commitments; that’s 11 new states since September 2022 (Arkansas, Idaho, Kansas, Kentucky, Louisiana, Nebraska, New Hampshire, South Dakota, West Virginia, Wisconsin and Wyoming), in addition to three new tribal schools, one private school operated by a tribal nation, Washington, D.C., American Samoa, Guam, Puerto Rico and the U.S. Virgin Islands. The 405 electric school buses awarded to these regions are entirely funded by EPA’s Clean School Bus Program.
California still leads in electric school bus adoption, with over 1,800 committed electric buses across the state, at least 35% of which are delivered or operating. This is more than five times as many buses as the next leading state, Maryland, with 361 commitments. Meanwhile, New York had the largest increase since September 2022 with 184 new commitments. The updated data shows electric school bus commitments are now more evenly distributed across the country.
Before October 2022, 59% of electric school bus commitments were in the West (based on U.S. Census regions), including over 50% in California. Now, California represents just 39% of committed electric school buses, only a little more than the South’s 34% share of commitments.
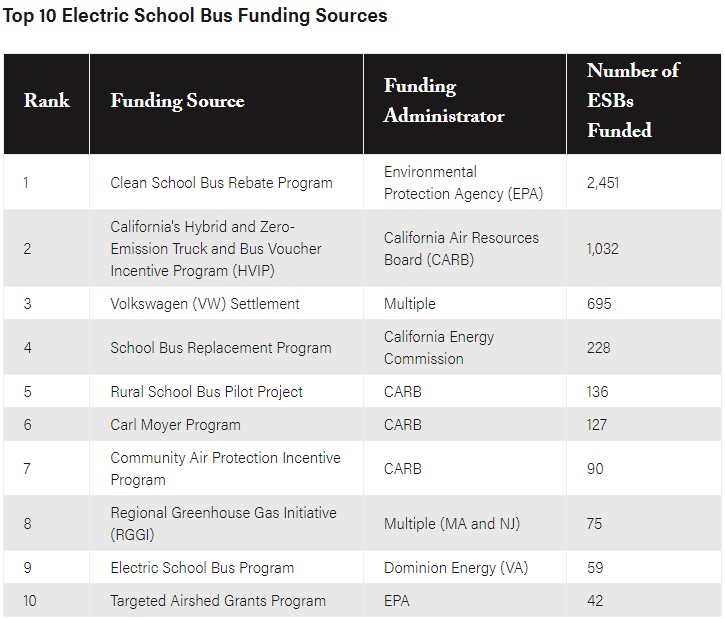
With 2,451 electric school buses awarded — and more on the way — EPA’s Clean School Bus Program far surpasses any other single funding source by number of buses funded. The next largest funding source is California’s Hybrid and Zero-Emission Truck and Bus Voucher Incentive Program (HVIP), which has funded 1,032 buses. Unsurprisingly, California-specific funding sources comprise five out of the 10 largest funding sources. The state’s robust incentive programs are partly why more than two thirds of all delivered and operational electric school buses can be found there.
The Number of Large Commitments for Electric School Buses Is Growing
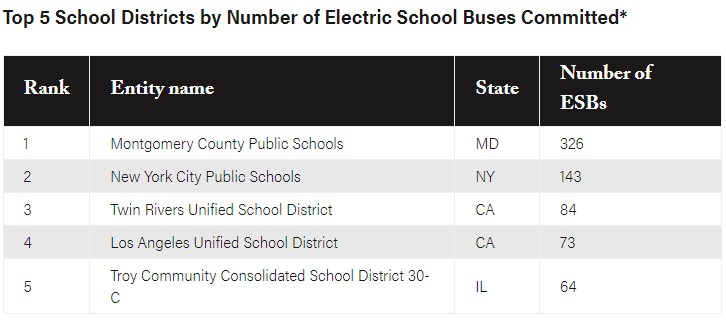
Most of the 895 U.S. school districts or private fleet operators with electric school buses — around three-quarters — have committed to more than one bus. One-third of all entities with electric school buses have committed to five or more and 157 (18%) have committed to 10 or more, compared to just 13 school districts in August 2021. All 50 states, plus Washington, D.C., Guam, Puerto Rico, the U.S. Virgin Islands and two tribal schools have at least two electric school bus commitments. Nine districts currently have a school bus fleet that is at least half electric and 70 districts have electric school bus commitments that amount to 50% or more of their current fleet size. These numbers suggest growing trust in electric school bus technology and market conditions, as well as wider funding availability.
Nearly 150 Districts with Electric School Buses have Gone Back for More
The dataset includes information on “batches,” or groups of electric school buses that went through the adoption process at the same time. We consider a district’s buses to be in the same batch if one of their adoption phases — when they were awarded, ordered, delivered or first operating — occurred within roughly six months of each other. For example, if a district ordered five buses in January and then ordered five more in May of the same year, those 10 buses would all be grouped into one batch. This variable can help to demonstrate adoption patterns at the school district level, like how batches differ in size and how long it takes before districts receive an additional batch.
Since September 2022, 17 districts have added a batch of electric school buses, bringing the total number of districts with more than one batch to 149. Ten districts — all in California — have as many as four batches. We found that most batches are small, with a median size of two buses. However, the batch sizes range widely, suggesting that they may be largely dependent on the amount and type of funding and financing available at the time.
The average time between a district’s batches is a little over a year. In general, districts’ later batches tended to come closer together than their first batches. Possible explanations for this trend are the increased funding opportunities in recent years or increased confidence in electric buses after the first batches.
Larger Buses Dominate Electric School Bus Sales
The dataset includes 13 different electric school bus manufacturers, with three major players: Blue Bird, Thomas Built Buses and Lion Electric, in order of buses committed.
School buses are generally classified into four categories based on size and construction: the smaller types A and B, which carry between 10 and 30 passengers and the larger types C and D, which carry between 50 and 90 students. The top three manufacturers all offer Type C electric models, which is the most common bus type, according to a 2021 maintenance survey conducted by School Bus Fleet Magazine. This aligns with our findings on electric school bus types; 54% of committed electric school buses are Type C, while 27% are the bigger Type D.
Is Electric School Bus Adoption Occurring Equitably?
EPA’s Clean School Bus Program prioritized school districts based on whether they were “high need” (including high-poverty districts and those located in the U.S. Virgin Islands, Guam, American Samoa or Northern Mariana Islands), rural, tribal, or a combination of these criteria. Out of all committed electric school buses that fit into the criteria of low-income, rural, tribal or located in a U.S. territory, the Clean School Bus Program funded most electric school buses in each of these categories.
Notably, the Clean School Bus Program led to a significant jump in the number of rural school districts with electric school buses. The share of districts with at least one electric school bus in each locale (rural, town, suburban and urban) now aligns almost exactly to the distribution of all school districts among these locales.
The amount of electric school buses in the fourth quartile of low-income school districts — those with the highest share of low-income households — has increased significantly, mostly due to the Clean School Bus Program’s prioritization of low-income school districts. Before October 2022, 25% of all electric school buses and districts with electric school buses were in the fourth quartile. Now, this quartile has 41% of electric school buses and 34% of school districts.
Electric school bus adoption appears to be occurring equitably when looking at how the vehicles are distributed among communities of color. Two-thirds of electric school buses are located in school districts in the highest quartile of non-white and/or Hispanic residents (defined as “Minority” in EPA’s EJScreen data). However, this share is down from 80% in September 2022, potentially because the Clean School Bus Program did not use race or ethnicity as prioritization criteria.
We compiled data on concentrations of Particle Matter (PM2.5) and ozone in school districts because of the harmful health effects of these pollutants, their close linkage to diesel exhaust and the availability of data. The data shows school districts with the highest levels of PM2.5 air pollution have committed more electric school buses. The trend differs slightly with ozone pollution. While the highest quartile of ozone pollution also contains the most buses, 30% of buses are in areas with the lowest levels of ozone, compared to 11% of buses that are in areas with the lowest levels of PM2.5.
School districts with electric school buses are fairly evenly distributed among different levels of adult asthma rates. While the highest concentration of vehicles is in the lowest quartile of asthma rates, it is only slightly more than the share of vehicles in the highest quartile. Plus, the percentage of buses in the highest quartile has risen from 13% in September 2022 to 28% in December 2022. This is a promising trend, but efforts must continue to ensure that electric school buses are brought first to communities that will benefit the most from air quality improvements.
Overall, committed electric school buses are largely concentrated in historically underserved school districts. We have seen an increase in buses in low-income areas and a majority of electric school buses located in school districts with a high population of non-white and/or Hispanic residents. However, there have been slight decreases in the share of buses in areas with the highest populations of people of color and in areas with the highest levels of PM2.5 and ozone pollution. As we scale up electric school bus adoption across the United States, we must continue to center communities that disproportionately bear the burden of on-road air pollution.
It’s important to note that the metrics we have chosen are by no means comprehensive. WRI is conducting more in-depth research on the equity of electric school bus adoption and continuing to work alongside partners to ensure that underserved communities remain front-and-center in the transition.
What’s Next to Scale Up Electric School Bus Adoption?
Our most recent update to WRI’s Electric School Bus Adoption dataset saw a substantial leap in the number of committed buses, in large part due to awards through EPA’s Clean School Bus Program. A second round of funding, in the form of a grant program, was announced by EPA on April 24. Following targets and funding passed by states like Colorado, Connecticut, Maine, Maryland, New York and New Jersey in 2022, we are seeing momentum for new funding and fleet transition targets proposed in even more states, including Hawaii, Illinois and Massachusetts.
This latest data shows that electric school buses have nationwide momentum. If progress toward an all-electric school bus fleet is to persist, policymakers at the federal and state levels, including state utility regulators, need to establish electric school bus enabling policies, such as fleet transition targets and programs to support charging infrastructure deployment. Federal and state governments can continue to address the upfront cost premium of electric school buses through new and augmented funding opportunities and, importantly, financing programs that help maximize the impact and reach of grants and leverage them for greater scale and ambition. Across these efforts, policymakers should ensure benefits are equitably accessible to communities that would benefit most from school bus electrification.
View past editions of this article:
- February 2023 Edition
- September 2022 Edition
- June 2022 Edition
- February 2022 Edition
- August 2021 Edition
This article was originally published on WRI’s Insights.
Lydia Freehafer is a Research Analyst I for the Electric School Bus Initiative and the New Urban Mobility Alliance (NUMO), hosted by WRI Ross Center for Sustainable Cities.
Leah Lazer is a Research Associate for the Electric School Bus Initiative and the New Urban Mobility Alliance (NUMO), hosted by WRI Ross Center for Sustainable Cities.

