

Posts tagged with 'data visualization'

Picture yourself on a lazy Sunday afternoon cruising down San Francisco’s Market Street in one of the city’s iconic streetcars. You have a seat to yourself to peer out the window as the sun beats down over the Golden Gate; ...

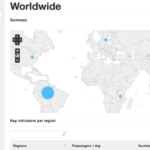
Join us on Tuesday, April 10 at 12:00 p.m. EDT for a webinar to launch BRTdata.org, the most comprehensive public database of bus rapid transit (BRT) systems around the world. Register for the webinar here. The new website was created by ...

Earlier this year, we wrote about the symbolism of October 31 in marking the day the world population reached 7 billion people. A design firm based in Boston, Mass., Fathom Information Design, created “Dencity,” a map of global population density as ...
This weekend, the Desarrollando América Latina Hackathon will take place across six countries: Brazil, Mexico, Peru, Argentina, Chile and Uruguay. The event focuses on solving social problems using web applications and public data. The goal of the event is to create ...

Did you catch yesterday’s Twitter chat on what it takes to be a smarter city? To promote its 2012 Smarter Cities Challenge, IBM hosted a discussion with Stanley S. Litow, IBM’s vice president of corporate citizenship and corporate affairs and ...

The United States Department of Transportation and the Transportation Research Board are sponsoring a data visualization competition, understanding that informed decision-making, based on sound data and analysis, is the cornerstone in crafting effective transportation policies and investments. The competition is ...

Photos by the Metropolitan Transportation Authority of the State of New York Metropolitan Transportation Authority, New York City’s public transit authority, revealed a new interactive touch-screen kiosk with real-time service status on Monday. The project, “On the Go! Travel ...

The Mobility Lab, a project by the Arlington County Commuter Services, is hosting the Transit Hack Day on Saturday, September 10 for developers, mappers and transit data enthusiasts in the Washington, D.C. metro area. Transit Hack Day provides a space ...

Welcome to “Research Recap,” our series highlighting recent reports, studies and other findings in sustainable transportation policy and practice, in case you missed it. Commuting in Canada A new survey by Statistics Canada about modes of commuting in the country found that ...

