

Posts tagged with 'maps'

Urban planners, designers and architects have their work cut out for them. The rate of urbanization around the world means that we have to reconfigure the way we think, design and plan cities. It is not like starting from scratch ...

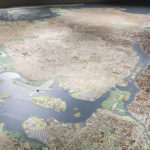
During last week’s Transforming Transportation conference, Jaime Lerner expressed that one of the greatest compliments he has ever received was from his driver who told him that Curitiba looked exactly like the architectural model Lerner was carrying with him at ...
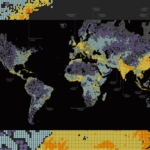
Earlier this year, we wrote about the symbolism of October 31 in marking the day the world population reached 7 billion people. A design firm based in Boston, Mass., Fathom Information Design, created “Dencity,” a map of global population density as ...
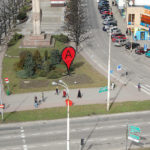
German artist Aram Bartholl has installed physical versions of Google Map’s red place markers in the middle of cities around the world. The urban art installation, “Map,” is meant to question the boundaries between the physical environment, the digital world and censorship. ...
The Mobility Lab, a project by the Arlington County Commuter Services, is hosting the Transit Hack Day on Saturday, September 10 for developers, mappers and transit data enthusiasts in the Washington, D.C. metro area. Transit Hack Day provides a space ...

Fadeout Design created maps out of typography for the transit systems of Boston, Chicago, London, New York City, San Francisco and Washington, D.C. The maps are minimalist in design and the lines are made up of strings of words that ...
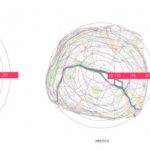
Xiaoji Chen, a graduate of the Massachusetts Institute of Technology, created isochronic maps of Paris and Singapore that represent distance on a map proportionally to travel time. The distorted maps show that the distance between any two stops in a city ...

Escuelab, Softwin, Social Media Group and Development Seed are hosting an Open Data event in Lima, Peru Saturday, August 13, 2011. The event, “Open Data Meetup Lima,” is a day of sharing ideas, activities and workshops related to open data ...
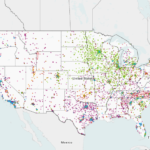
Today, the U.S. Department of Energy released an interactive map displaying thousands of alternative fuel stations around the nation, as part of a complete overhaul of Energy.gov. Color-coded points represent various alternative fuel sources, including electric and hydrogen stations. In ...
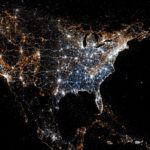
Eric Fischer, a programmer and designer, created maps showing the locations of people when they send a Twitter message or upload a photo to Flickr. Orange dots represent the location of Flickr pictures, blue dots represent Twitter tweets and white dots ...
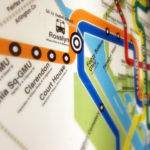
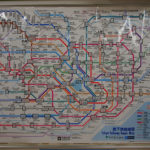
Washington, D.C. metro officials, in an effort to improve the current metro map, have hired Lance Wyman, the creator of the original map, to reconfigure and tweak his design. The redesign aims to better illustrate the changes in service during ...

Hansel and Gretel may have had bread crumbs to lead their way, but New York City’s pedestrians will have something less edible to follow: Maps! Taking a page from London’s pedestrianization efforts, New York City’s Department of Transportation released a ...
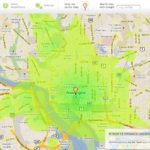
Want to know how far you can travel using public transit under 15 minutes? There’s a map for that! Stefan Wehrmeyer, a Berlin-based software architect developed a tool that uses public transit data to help users decide on where to ...

Welcome to “Research Recap,” our series highlighting recent reports, studies and other findings in sustainable transportation policy and practice, in case you missed it. Renewable Energy Estimates A recent report by the Intergovernmental Panel on Climate Change (IPCC) calculated that ...
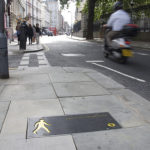
Transport for London (TfL), the government body in charge of Greater London’s transit system, installed pedestrian-friendly maps in strategic decision-making spots, like subway entries and bus stops, to encourage walking. In addition to being a healthy and environmentally friendly mode ...

